Uncovering Patient Satisfaction Insights with AI Data Analysis
Explore how AI-driven analytics are transforming patient satisfaction assessment, identifying factors that influence patient experiences, and personalizing healthcare services. Learn how Vizly enhances this process by processing extensive patient feedback data to revolutionize care delivery and patient management.
Getting Started
To get started with uncovering your patient satisfaction insights, import your data into Vizly. Vizly can accept CSV, Excel, JSON, and SPSS files, and can also import data from Google Sheets. For more instructions on how to get started, check out our Getting Started guide.
We will be using a patient satisfaction dataset for this example.
Understanding the Data
To get an initial understanding of the data, we will ask Vizly for an overview of key patient satisfaction metrics such as communication with nurses, responsiveness of hospital staff, and overall hospital ratings.
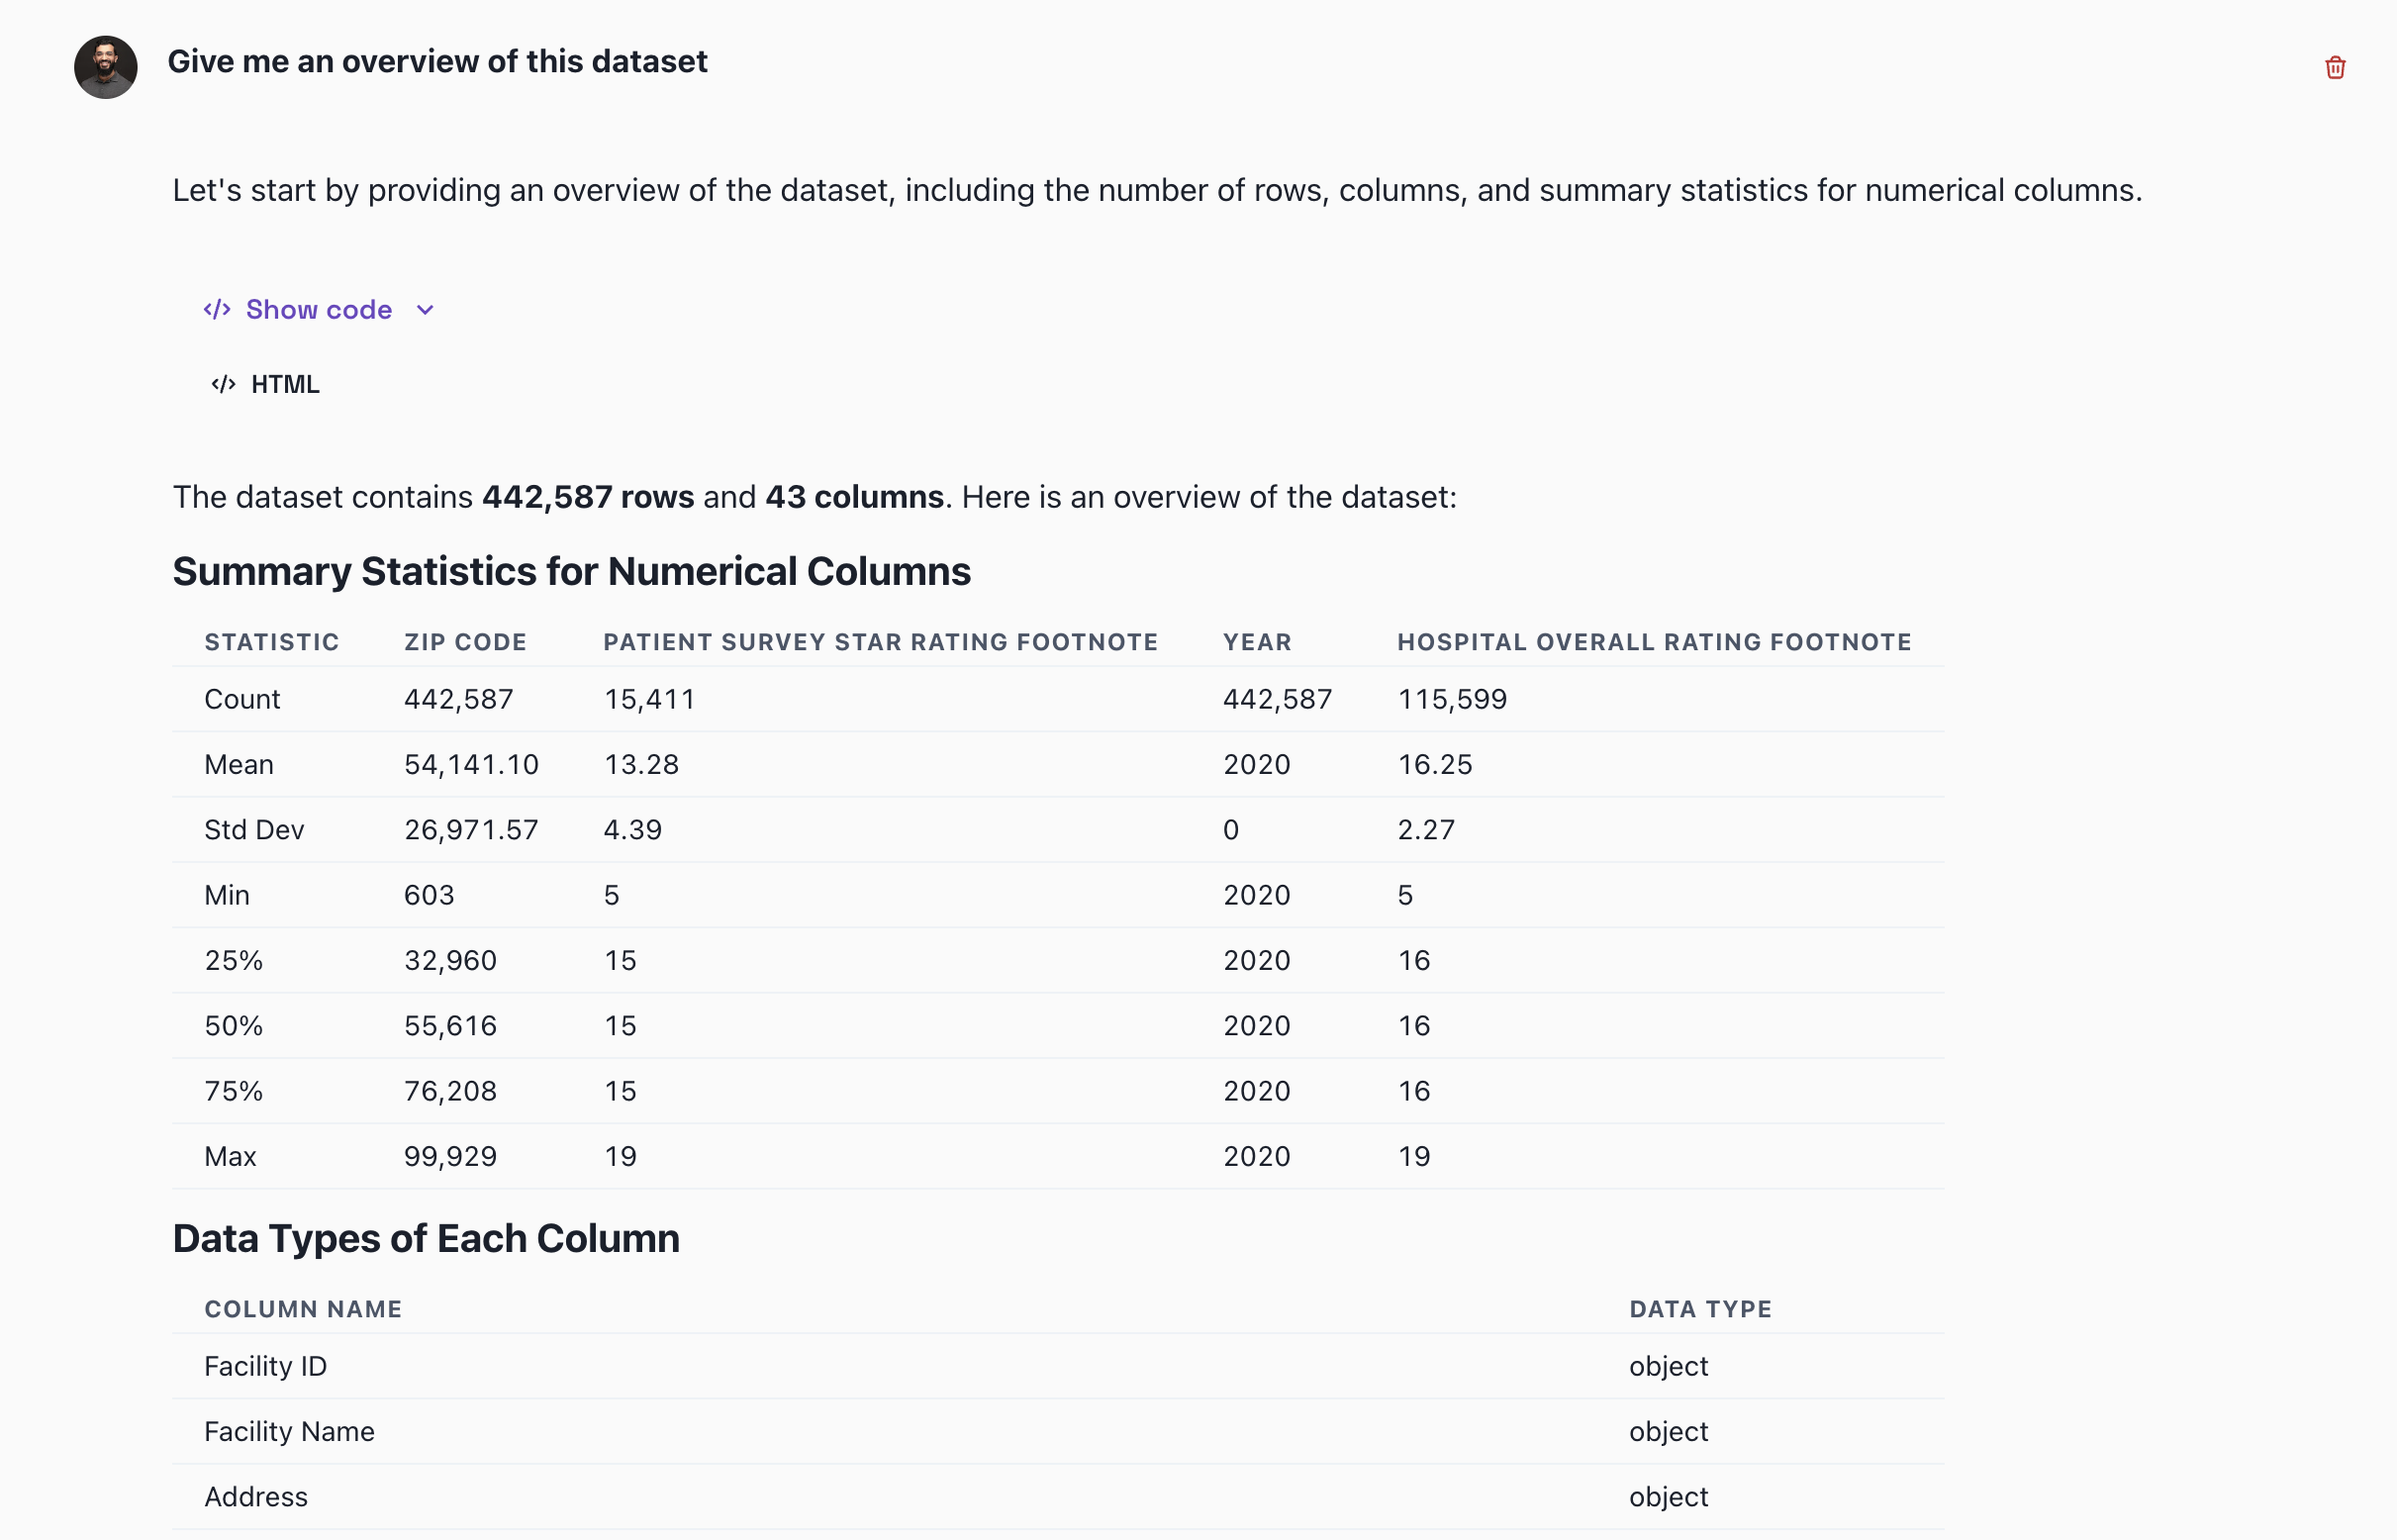
Vizly provides an overview of key patient satisfaction metrics such as communication with nurses, responsiveness of hospital staff, and overall hospital ratings.
By examining these metrics, we can identify patterns that contribute to overall satisfaction. A significant positive correlation between the quality of nurse communication and overall hospital ratings suggests that improving nurse communication can lead to higher patient satisfaction. Vizly can highlight such relationships, allowing healthcare providers to focus on key areas for improvement.
In this example, the graph below shows the relationship between the clarity of explanations provided by doctors and nurses, and the corresponding satisfaction levels. As depicted, clear communication by both doctors and nurses is highly correlated with higher patient satisfaction, underscoring the importance of effective communication in healthcare settings.
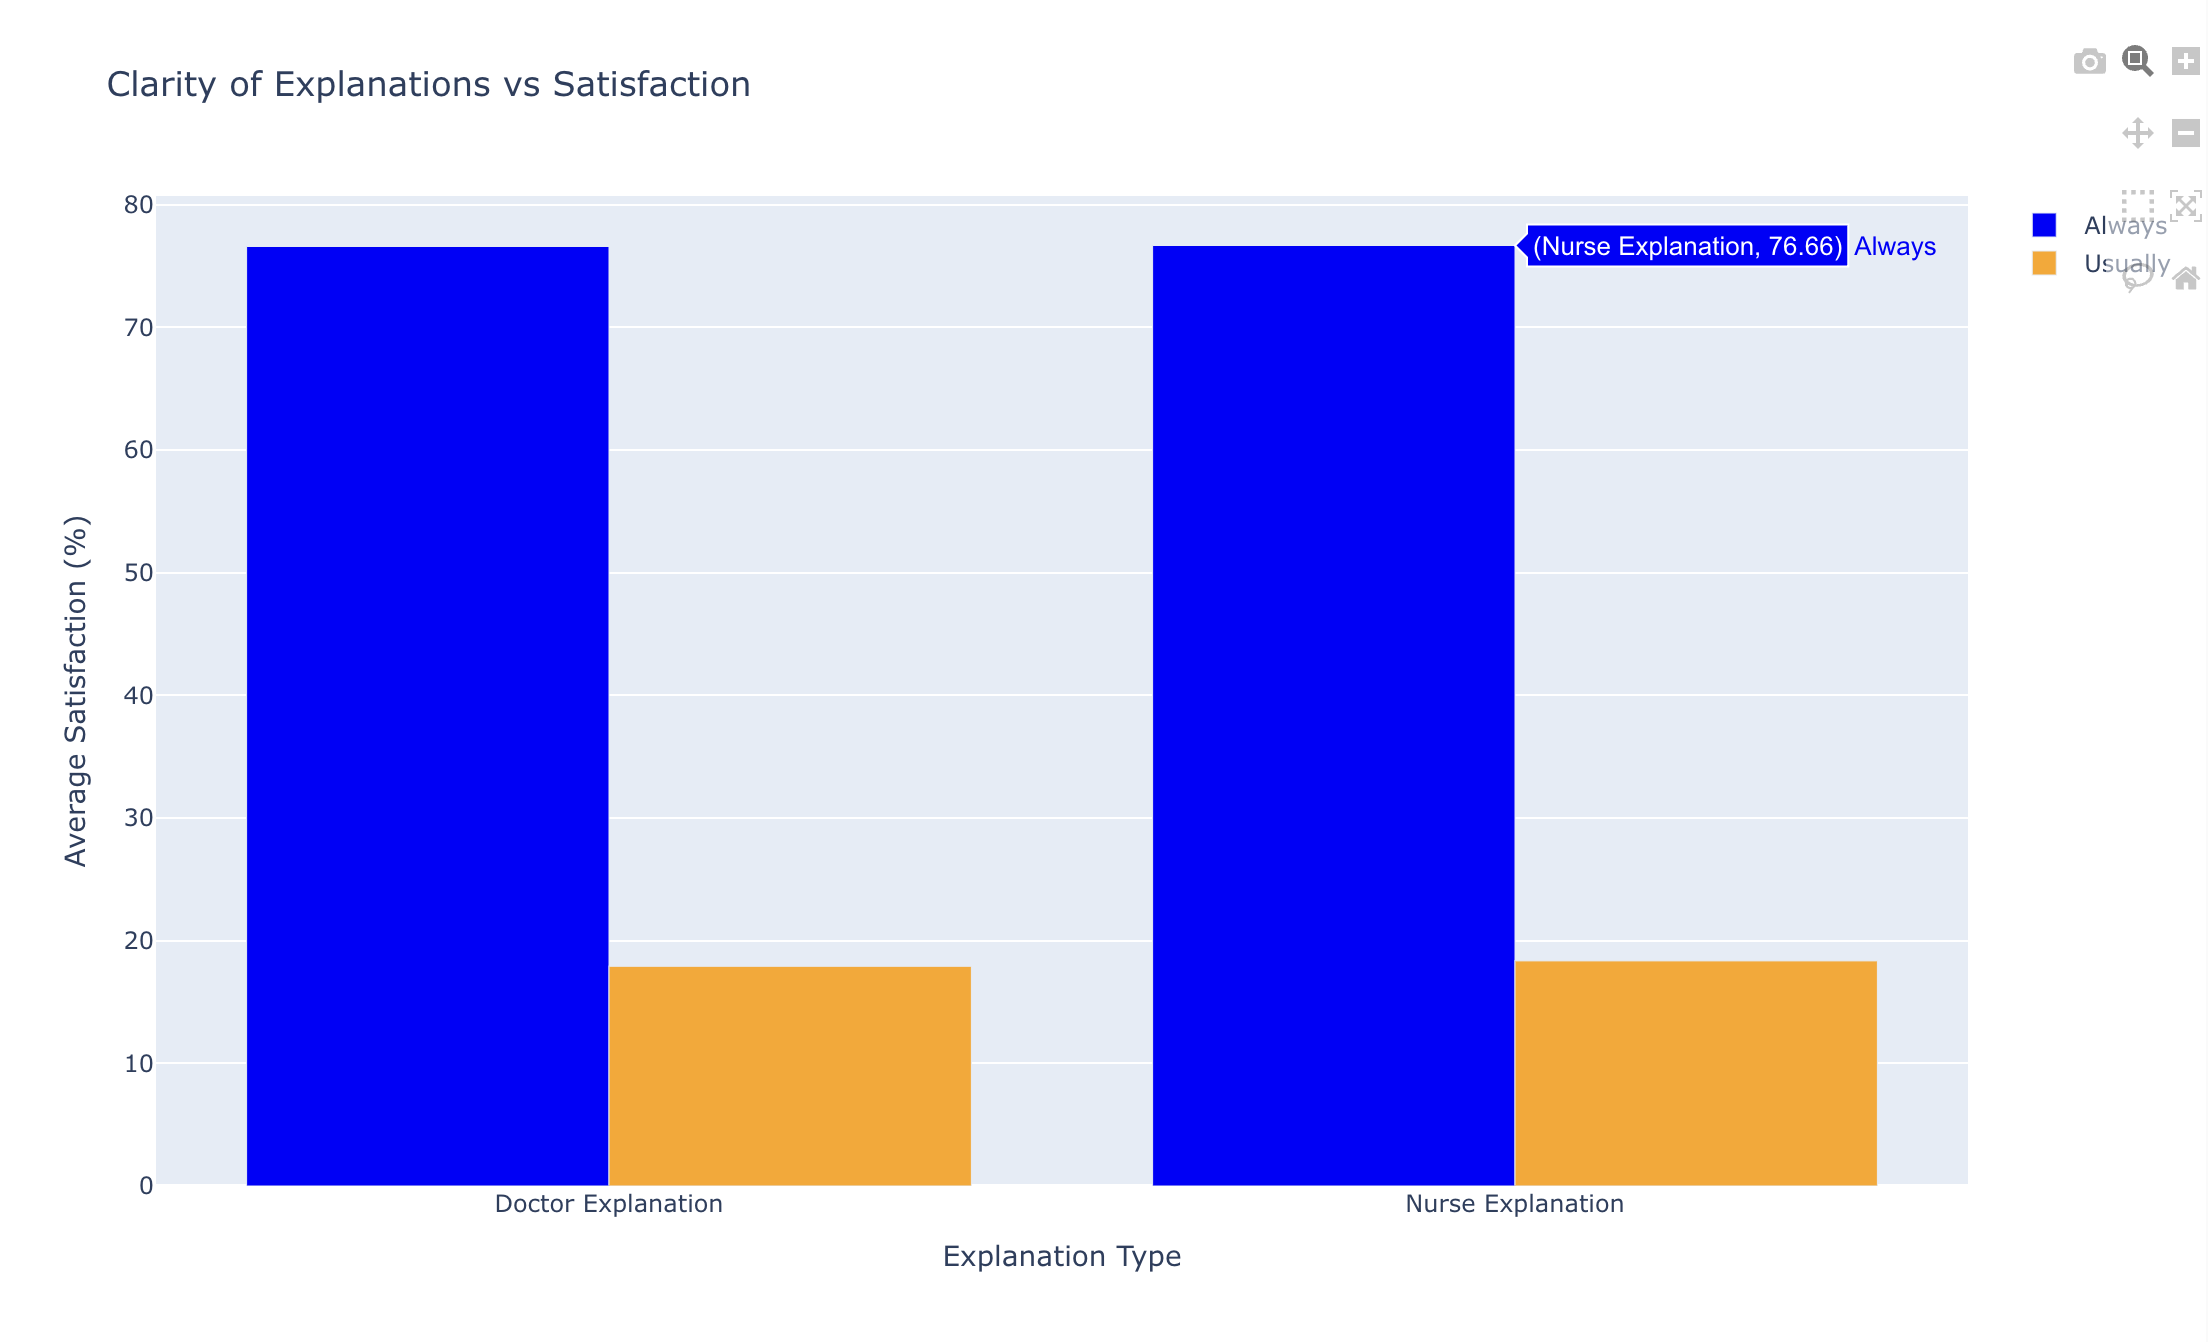
Clarity of explanations by doctors and nurses is positively correlated with higher patient satisfaction.
Using Vizly, you can create detailed dashboards that show monthly or quarterly trends in patient satisfaction. Interactive charts and graphs help you delve deeper into specific feedback or service areas that impacted overall satisfaction.
Case Study: Improving Patient Satisfaction
Imagine you're a healthcare administrator tasked with improving patient satisfaction at a hospital. By importing your patient satisfaction data into Vizly, you can:
- Identify key areas of dissatisfaction based on historical data and predictive analytics.
- Analyze feedback patterns to refine service improvement strategies.
- Create visual dashboards that highlight key metrics and performance indicators.
Conclusion
Vizly is an indispensable tool for healthcare providers, streamlining data analysis and enhancing insights into patient feedback data. By utilizing Vizly’s interactive visualizations, automated insights, and advanced predictive models, healthcare professionals can make informed decisions that optimize service delivery and maximize patient satisfaction.
Key Features of Vizly:
- Interactive Visualizations: Create detailed charts and graphs to explore patient feedback data effortlessly.
- Automated Insights: Receive automated suggestions and insights to quickly uncover key trends.
- Advanced Predictive Models: Utilize machine learning models to forecast future patient satisfaction trends and identify improvement areas.
- User-Friendly Interface: Import data, ask questions, and generate insights with ease.
Try Vizly now
© 2024 Squared Technologies, Inc.