Leveraging AI for Genetic Research
Discover how Vizly enhances genetic research by providing AI-driven insights and visualizations, making complex data analysis accessible and efficient.
Introduction to Vizly for Genetic Research
Genetic research involves analyzing vast amounts of complex data to understand the structure, function, and regulation of genes. This data can provide critical insights into genetic disorders, evolutionary biology, and personalized medicine.
Vizly, with its robust AI-driven data analysis and visualization capabilities, transforms how researchers interact with genetic data. By integrating Vizly into your research workflow, you can uncover hidden patterns and gain deeper insights without needing advanced bioinformatics skills.
To get started with Vizly, sign up and enhance your genetic research projects with Vizly.
Dataset Overview
This dataset comes from a proof-of-concept study published in 1999 by Golub et al. It showed how new cases of cancer could be classified by gene expression monitoring (via DNA microarray) and thereby provided a general approach for identifying new cancer classes and assigning tumors to known classes. These data were used to classify patients with acute myeloid leukemia (AML) and acute lymphoblastic leukemia (ALL).
The dataset contains measurements corresponding to ALL and AML samples from Bone Marrow and Peripheral Blood. Intensity values have been re-scaled such that overall intensities for each chip are equivalent. For more details, you can access the dataset from Kaggle.
Identifying Differentially Expressed Genes
Vizly simplifies the process of identifying differentially expressed genes. With just a few clicks, you can perform advanced statistical analyses to find genes that are significantly up- or down-regulated in your dataset.
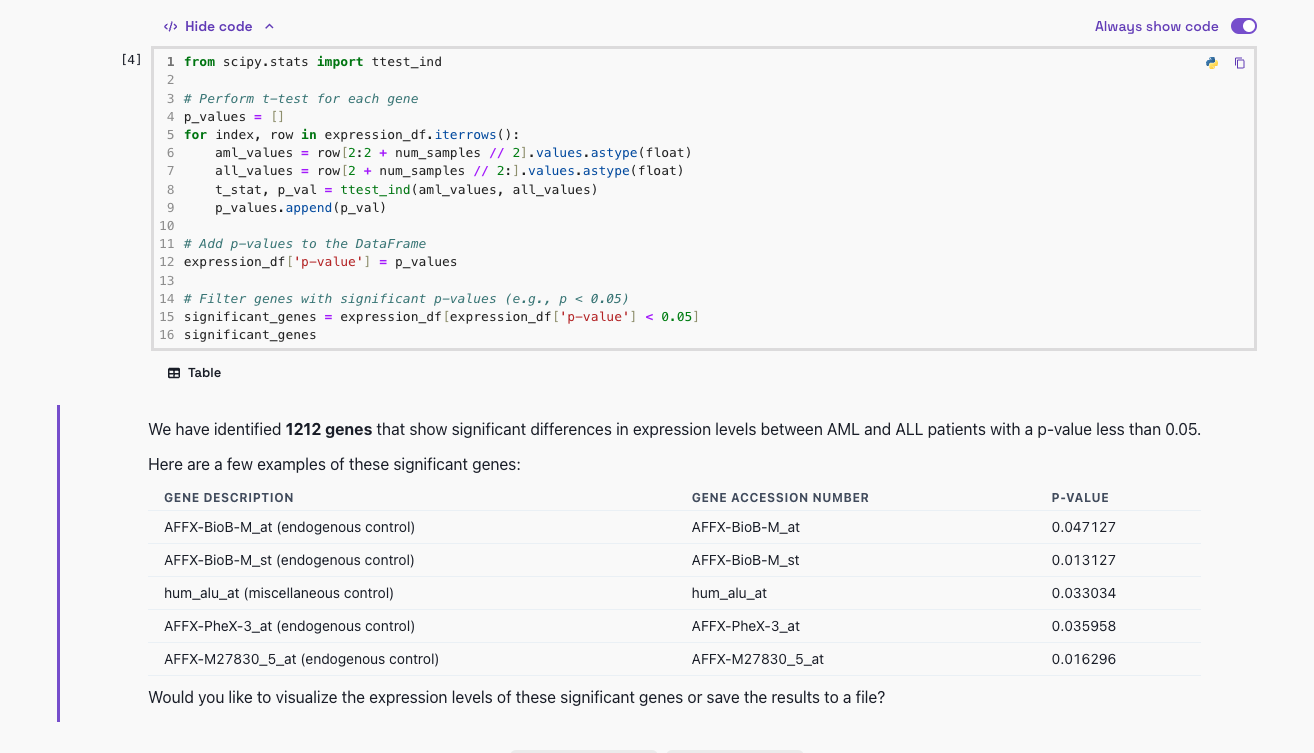
Identify differentially expressed genes effortlessly.
In this dataset, we identified several genes that show significant differences in expression levels between AML and ALL patients. These genes can serve as potential biomarkers for these types of leukemia.
Visualizing Gene Expression Patterns
Vizly's powerful visualization capabilities allow you to create a variety of plots to explore gene expression patterns. From heatmaps to volcano plots, Vizly provides the tools you need to visualize your data effectively.
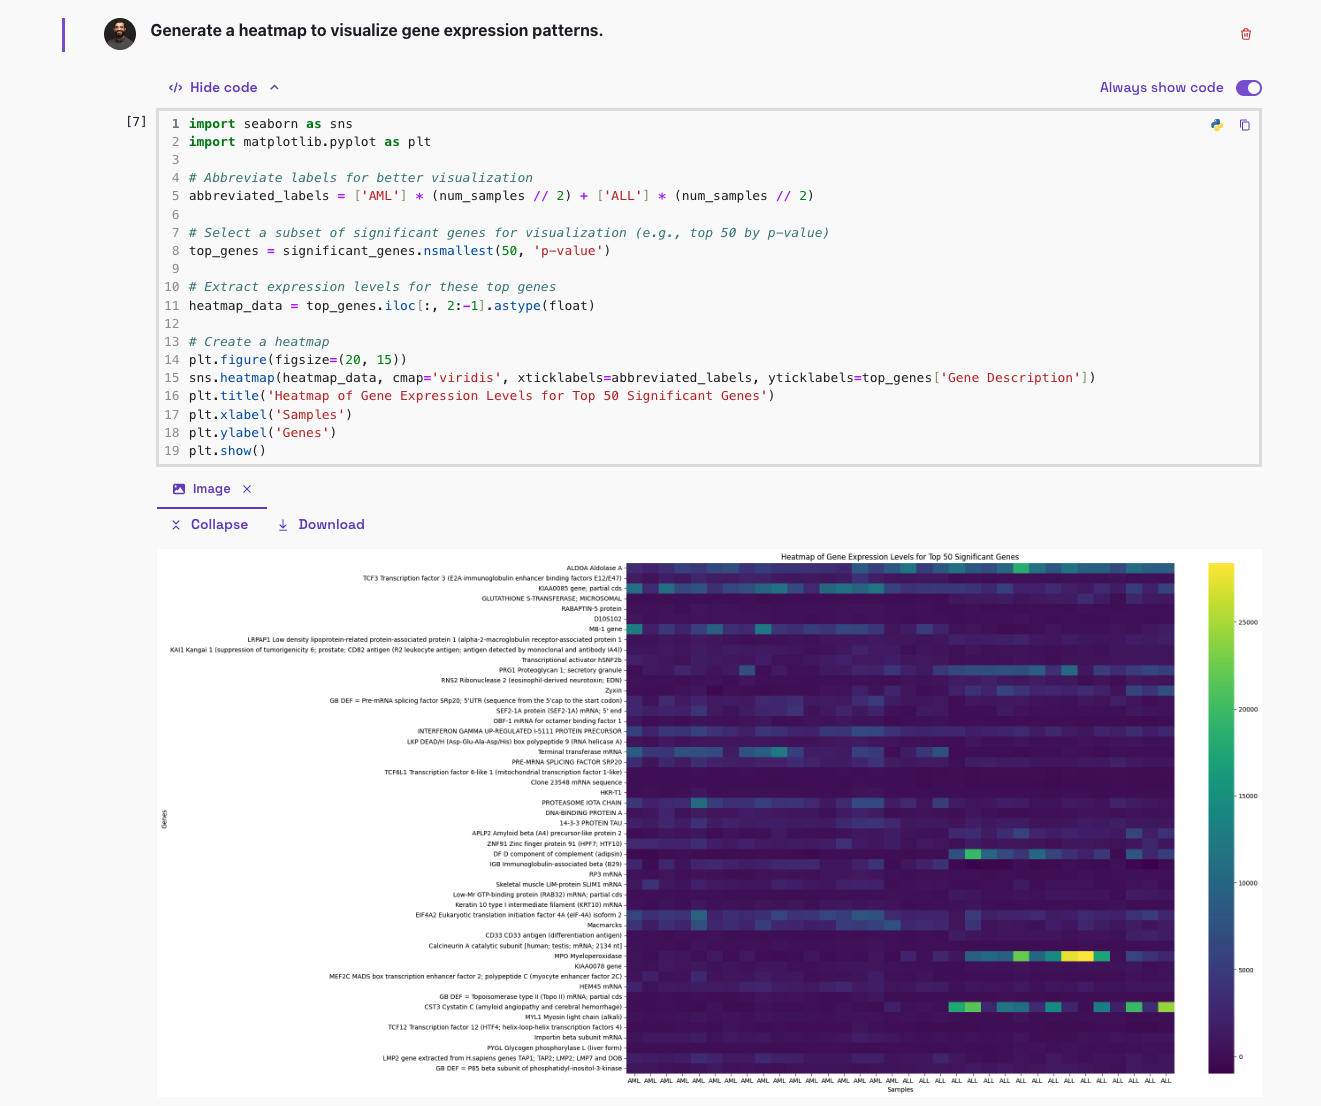
Generate heatmaps to visualize gene expression patterns.
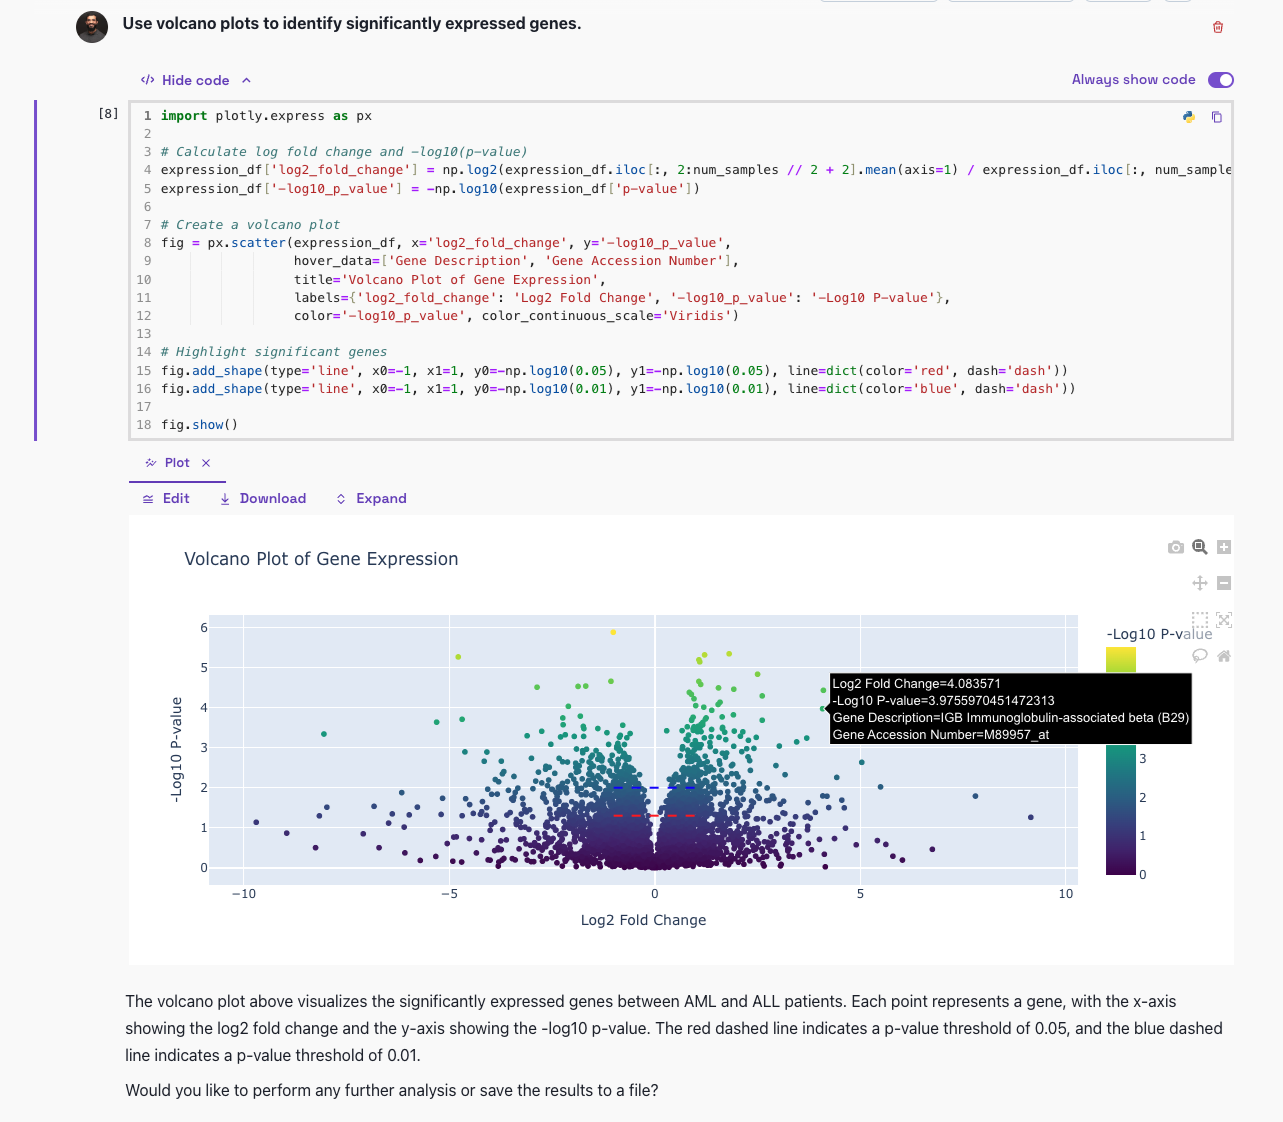
Use volcano plots to identify significantly expressed genes.
These visualizations help you quickly identify trends and outliers in your data, facilitating deeper insights and more informed research decisions.
Correlating Gene Expression with Phenotypes
Understanding the relationship between gene expression and phenotypic traits is crucial in genetic research. Vizly makes it easy to correlate gene expression data with phenotypic information, helping you uncover potential genetic markers for various conditions.
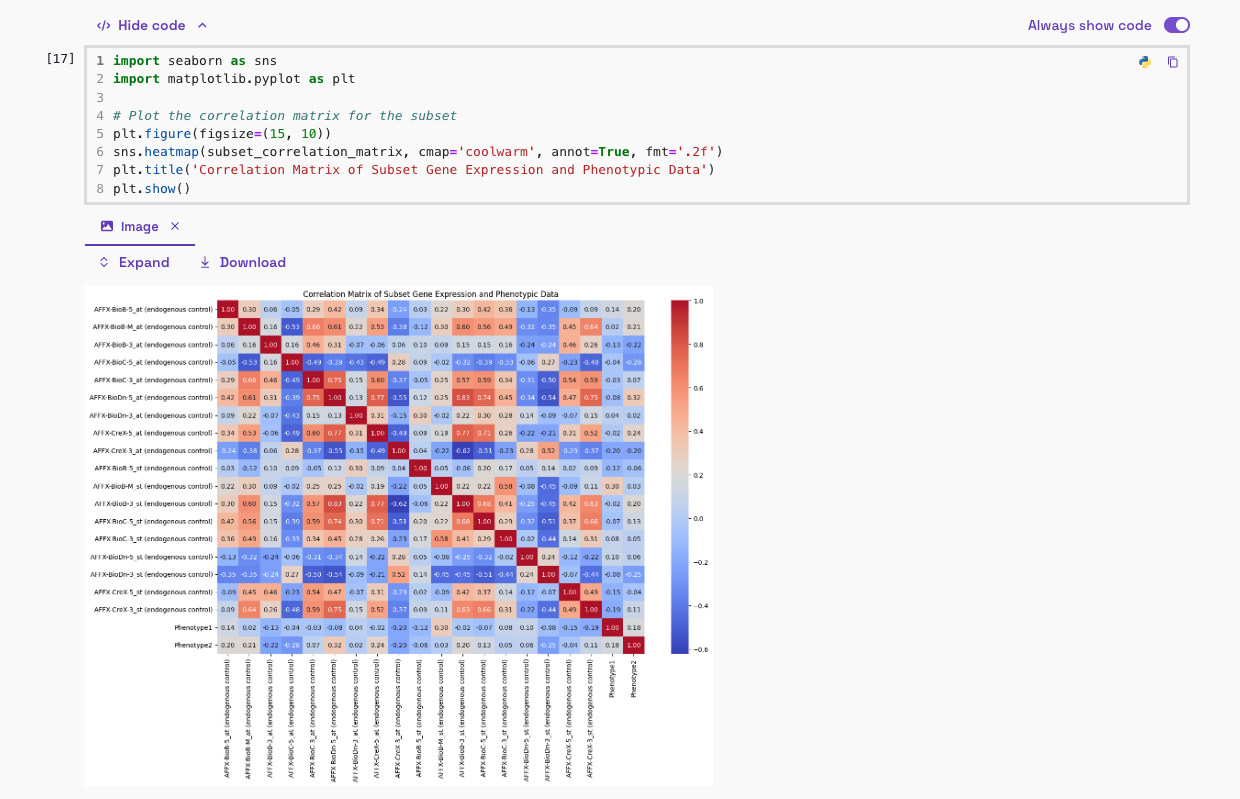
Visualize correlations between gene expression and phenotypes.
By leveraging Vizly's AI-driven analysis, you can uncover meaningful insights from your data, aiding in the discovery of genetic underpinnings of diseases and other traits.
Conclusion
Vizly transforms the way you interact with genetic data by automating complex analyses and providing intuitive visualizations. This allows you to focus on deriving actionable insights and advancing your research without being bogged down by technical complexities.
Try Vizly now